In late October the mind – at least in the US – turns to brews, potions and mixtures as Halloween looms and faux witches cauldrons dot suburban lawns.
Here at EPFR, members of the data provider’s quant team have been mixing cuts of our fund flows and foreign exchange (FX) allocations datasets in hopes of unlocking additional alpha from the trading of emerging markets currencies.
As it turns out, when the mixture is properly concocted it provides a useful contrarian signal. Incorporated into a basic long-short strategy, that signal has generated additional returns five of the past six years.
Don’t confuse your newts and toads
FX allocations are the percentage weight that a fund is exposed to each currency through the assets that they hold. EPFR maps each individual security in the file to the currency in which it is traded. For example, in the FX Allocations database a Microsoft share would be mapped to the US dollar.
EPFR began collecting data on the allocations by funds to individual currencies in 2019 and has built out the dataset’s history back to 2014.
Before that, a significant number of clients used EPFR’s country allocations to develop new windows into FX markets. So, it is worth addressing the difference between FX and country allocations.
There are two key differences. They are (a) that FX allocations captures the currency in which a security is traded whereas the country-allocations looks only at the geographic impact and (b) the FX allocations data is collected over a longer period which allows more funds to be included in the contributing universe.
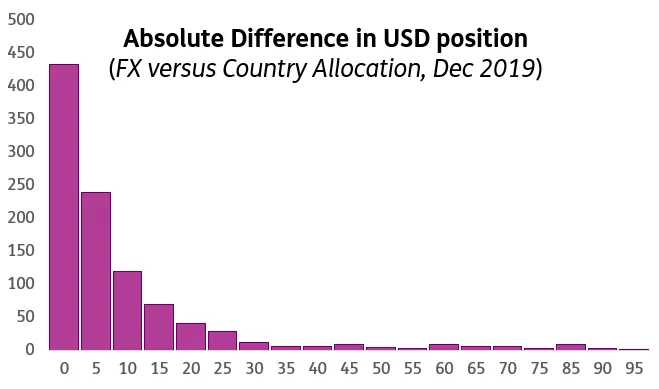
The chart below shows, for funds in common, absolute differences in USD positioning, fund-by-fund, between the FX and country allocations datasets at the end of December 2019. The X-axis has the percentage absolute difference, rounded to the nearest five percent, whereas the Y-axis shows the fund count.
Turning to the second difference, the FX allocations data is available T+39, assuming that day does not fall on a weekend or market holiday.
Bringing fund flows to the party
To develop our EM currency signal, we combine EPFR’s FX allocations and weekly flows.
The vast majority of the funds reporting FX allocations to EPFR also report weekly fund-level flows. For each week, using the latest FX allocations known at that time, one can look at all equity funds reporting both weekly flows and FX allocations.
Pro-rata splitting up each fund’s flows amongst the various currencies to which it allocates, and then summing up flows into each currency, yields total flow into currencies from this universe of funds. Doing the same thing with assets, rather than flows, yields the total dollar position in these currencies by these same funds. Dividing, for each currency, the former by the latter yields a percentage flow.
These flows can be volatile, so we smooth the signal by compounding over the latest-available four weeks. Based on our country-selection experience, we expected four-week flow to be a momentum indicator for EM FX. To our surprise, the results for that were lackluster.
We then turned this into a contrarian signal by multiplying the percentage flow numbers by negative one. In this scenario, high flows are bad and low are good. We found that this worked well as a reversal factor.
Fine tuning
We use the above indicator to predict EM currencies. A currency is considered an EM currency if:
-
- the parent country belonged to MSCI EM as of the trade date
- the currency was not pegged to, or actually the same as, the US dollar or the Euro.
The first week for which we have flows and FX allocations is that ending on 1st April 2015. Our returns dataset extends to 7th January of this year. Over that period, MSCI EM experienced the flowing index changes:
-
- Pakistan came in after May of 2017.
- Argentina and Saudi Arabia came in after May of 2019.
We account for this by only trading the Pakistan rupee after May of 2017 and the Argentine peso after May 2019. Saudi Arabia does not matter because they peg to the dollar.
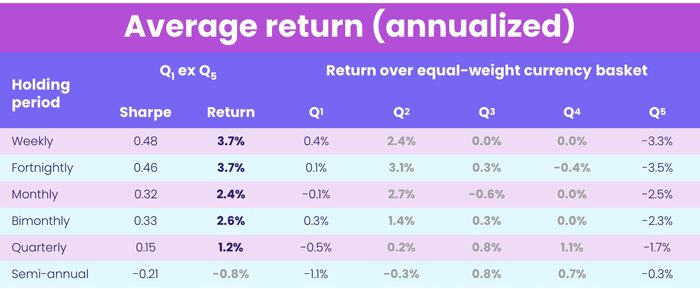
We look at holding periods between one week and six months. At the beginning of each period, we construct the reversal signal using the latest four weeks for which we have percentage flow. We consider only those currencies which were EM currencies at the time. We rank these into five buckets based on four-week reversal so that quintile 1, or Q1, has the currencies with the lowest flows and quintile 5, or Q5, has those with the highest.
The table below shows annualized returns to each quintile in excess of those accruing to the equal-weight basket of EM currencies.
Don’t hang on too long
As you can see from the table above, flow reversal works on EM currencies over a period from one week to three months. As one might expect, the returns drop off as the holding period increases.
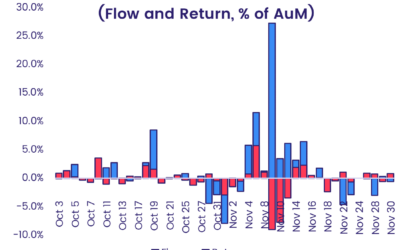
We also looked at weekly returns to the strategy by calendar year. The chart below shows returns to the top less those of the bottom quintile averaged by calendar year and then annualized.
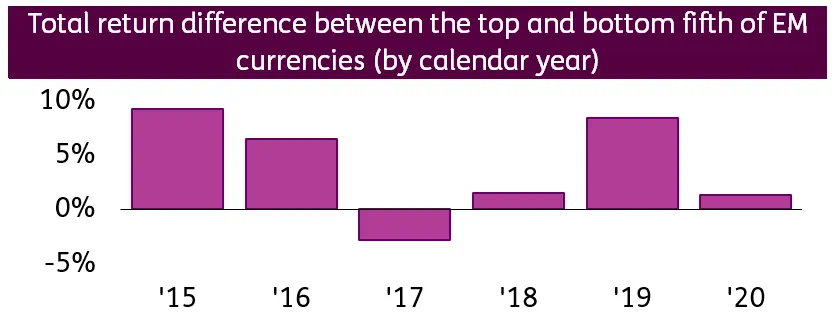
As you can see from the chart above, the strategy has delivered positive returns every year except 2017. It proves that combining FX allocations data with weekly flows can yield a useful predictor amongst EM currencies.
Did you find this useful? Get our EPFR Insights delivered to your inbox.