MSCI developed the classification of country equity stock markets based not only on how advanced, economically, the country is, but also how easy it is for global investors to access its domestic stock market. While most people are familiar with developed and emerging markets, the top two levels, they may not know much about the third, frontier markets. On the one hand, frontier markets are more risky and less liquid to invest in than an emerging market. But they offer a number of advantages. They offer exposure to potentially very high rates of growth. They are relatively uncorrelated to more established markets. Last, but not least, they are not an absolute no-go zone for the global investor. That status is occupied by MSCI’s fourth level, Stand Alone markets, which includes such markets as Lebanon, Venezuela and Russia. The current list of frontier markets, as defined by MSCI, includes the following countries: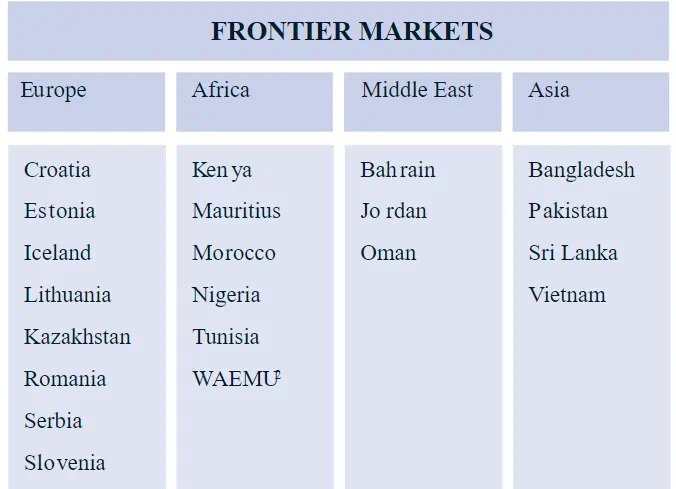
In this article, looking through the lens of EPFR’s flow data, we show how one might profitably deploy capital to frontier equity markets. Although EPFR does track flows to Frontier Markets Bond Funds, that will be the focus of a future piece.
Casting a wide net with some holes
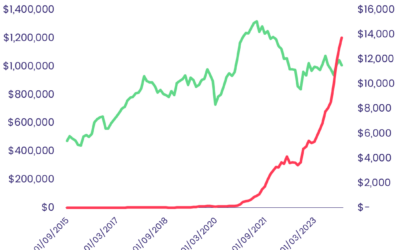
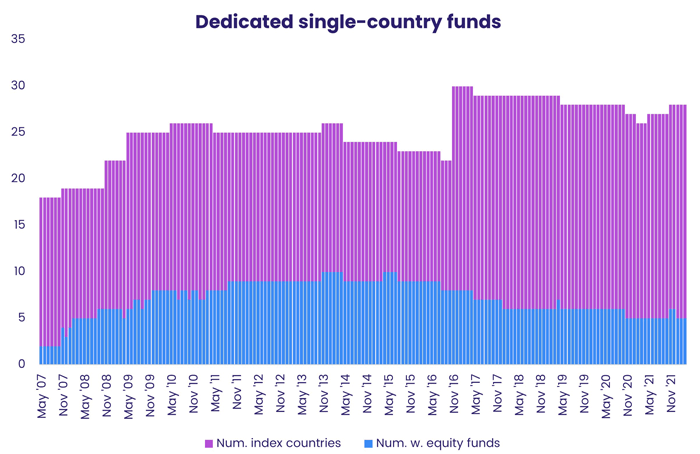
EPFR-tracked funds can be divided into two types, single-country and cross-border. For a frontier market to have single-country fund flows, someone needs to go start a fund dedicated to that country. The chart below shows, for each month, the total number of fronter-market countries (pink) as well as the number of those with at least one dedicated country fund reporting monthly data to EPFR (green). As you can see from that chart, dedicated coverage of these markets leaves a lot to be desired.
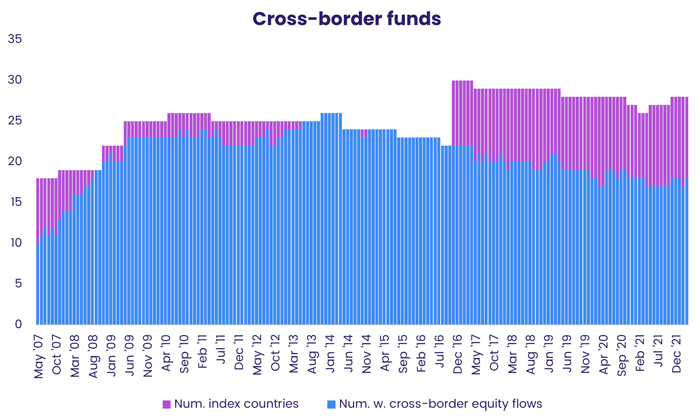
When we turn to cross-border funds — those investing in a range of countries – the picture improves. For a frontier market to get flows from these ‘allocator’ funds, all that is needed is the fund to have a mandate that includes the relevant markets and a manager willing to steer some of their fund’s capital there. Not surprisingly then, there is far better coverage of frontier markets when looking at cross-border funds.
Having established that, for reasons of coverage, we must use cross-border funds, we can move on to the next question: how to utilize this data profitably.
Fashioning a predictor
Srimurthy et al showed that countries with high cross-border flow outperformed those with low cross-border flow. In their analysis, however, they limited themselves to the top two levels, developed and emerging markets. In this article we will train their 20-day flow predictor on frontier markets. For each day and country, the existing predictor utilizes all cross-border funds reporting flows for that day to EPFR as well as country allocations for the latest-available month. For each such fund, take the portion of fund flow commensurate with the fund’s allocation to a country. Summing across all the funds yields total flow into the country from cross-border funds tracked by EPFR. Doing the same thing for total assets held in the country by the same funds. Scaling total flow by total assets gives one the percentage flow into the country from EPFR cross-border funds. Finally, compounding this indicator across the last twenty days creates the four-week flow indicator of Srimurthy et al.
A new frontier for returns
For each country we download monthly USD net returns from the MSCI website. We did this for any country that was categorized as a frontier market for at least one month between May 2007 and March 2022. We were able to find country index returns for all save Benin, Burkina Faso, Guinea-Bissau, Mali, Niger, Togo and Iceland. As a consequence, throughout the rest of this article we drop these countries from consideration. Each month, between May 2007 and March 2022, we ranked all the frontier markets that were in the index at the end of that month into five portfolios based on the latest-available four-week percentage flow. We held each portfolio for a month before rebalancing again at the end of the holding period. We repeated the above exercise for quarterly, semi-annual and annual holding periods. The table below shows returns to each of these portfolios in excess of the equal-weight average among frontier-market countries. The first quintile (Q1) is the high-flow portfolio, Q5 the low, with Q2, Q3, and Q4 falling in the middle.
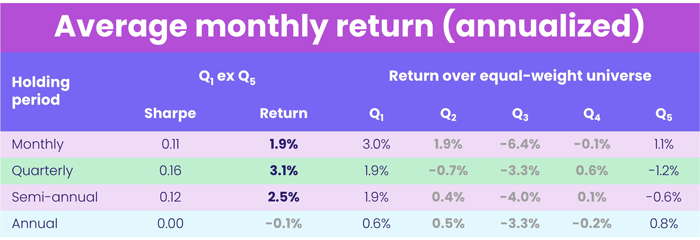
As you can see, the flow indicator of Srimurthy et al works in the direction you might expect when extended to frontier markets. The signal has predictive value out to six months, which is handy given the liquidity costs associated with trading in these countries. The fact that quarterly holding period is associated with a stronger signal than the monthly suggests that some lagging of the indicator might improve the signal. More work can also be done to bring in single-country flows as an auxiliary indicator. This will be left to a follow-on article.
References
[1] Srimurthy, V. K., Shen, S., & Smalbach, M. (2018). Fund Flows as Country Allocator. The Journal of Alternative Investments, 21(3), 87-95.
Did you find this useful? Get our EPFR Insights delivered to your inbox.