Insights
Proprietary market data and analysis
Quant Insights
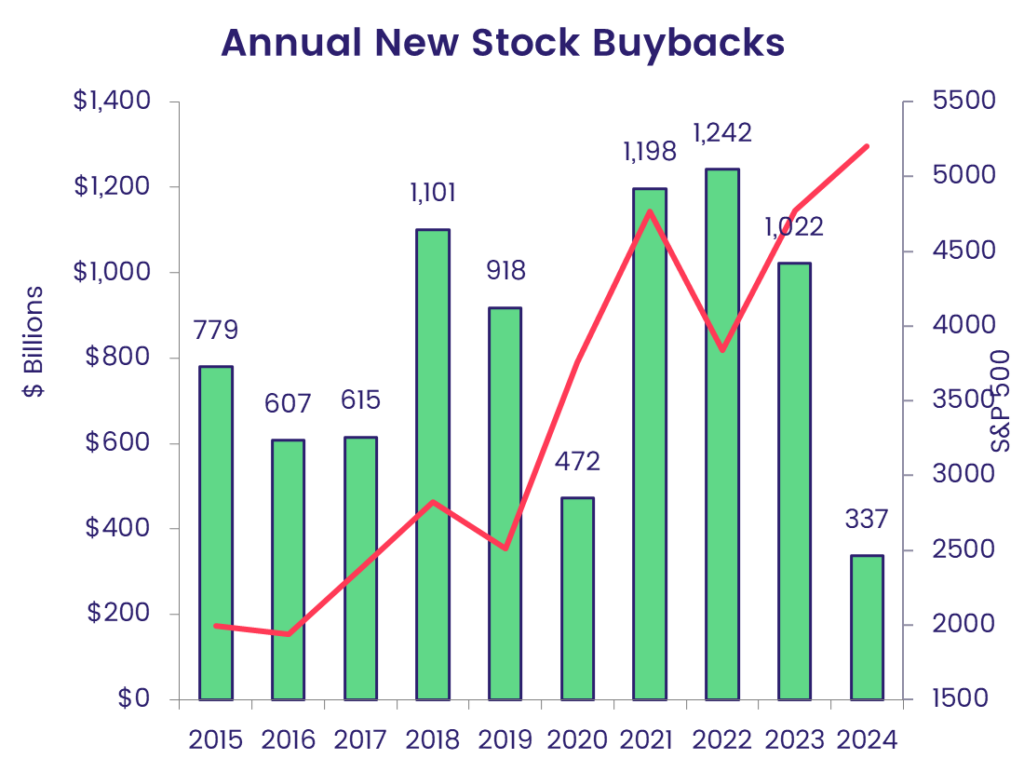

Corporate America’s trillion dollar put
Last year, US companies spent over $1 trillion buying back their own shares. It was the third consecutive year in which repurchases topped the $1...
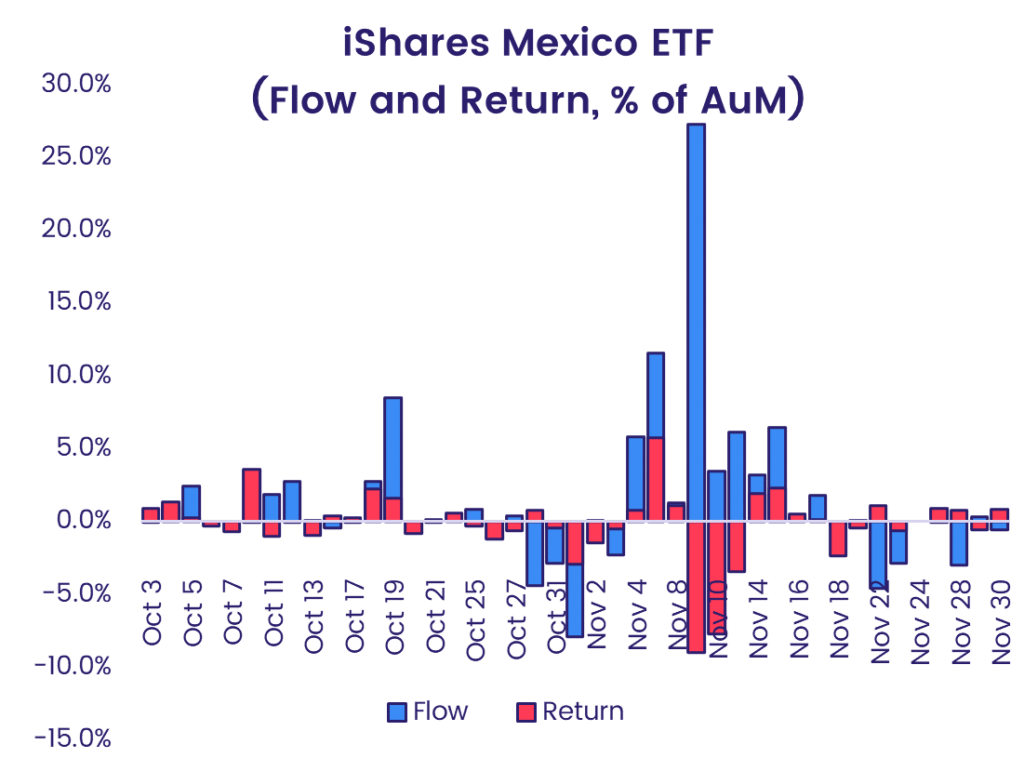
Getting ready for an anomalous election
Although the 2024 US presidential election looks likely to be a re-run of the 2020 contest, it still meets the classic definition – irregular,...
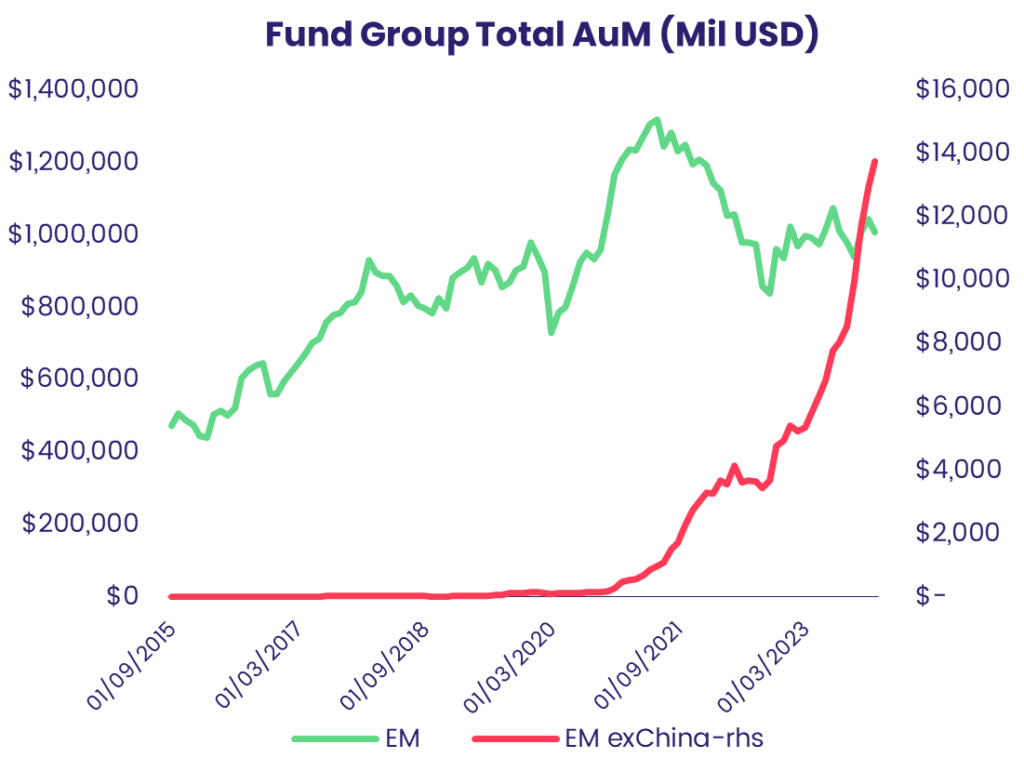
Ex-China Funds: A shooting star or a new constellation?
The debate among investors over China’s place in the emerging markets universe and the appropriate level of exposure to the world’s second-largest...
Economist Insights

The cruelest month shows its colors
April is known for its showers, warming trends and sudden changes in climate. This April, it has been missiles and attack drones that made up the...
Investors feel the squeeze in early April
There were some unwelcome additions to the “higher for longer” list during the first week of April as geopolitical risks and energy prices joined US...
America’s economic strength weighs on pivot projections
Although Switzerland’s central bank kicked off its latest easing cycle in late March, the second quarter started with investors digesting an...
Multimedia

1Q24 Recap Webinar
EPFR’s CIO, Sayad Baronyan, and Research Director, Cameron Brandt, will dig into the data from 1Q24 and highlight areas that will play a role in...

Market Insights: GEM Ex-China
Join us for our 20-min Market Insight call on GEM Ex-China, hosted by EPFR’s Research team; Cameron Brandt, Steven X. Shen, CQF and Kirsten...

Equity Research Webinar
After a decade where a rising tide of liquidity lifted most equity markets, analyzing this asset class has rapidly become more complicated ats the...
Papers

EPFR Papers: Estimating asymmetric price impact
This paper studies the asymmetric price impacts mutual fund and ETF flows have on individual stocks in demand-based asset pricing.
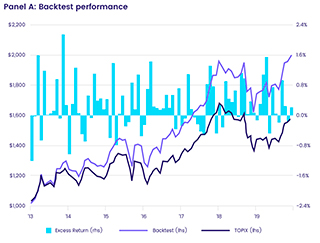
A rising tide lifts some (Japanese) boats: The Bank of Japan’s ETF purchases and their impact on market signals for individual stocks
The Bank of Japan has been the pace-setter among central banks when it comes to purchasing non-government financial securities. It was the first...

Oil bonds still have fuel in the tank – but how long will it last?
Fixed income markets are abuzz about the spectacular demand for new green bonds. Flows into fixed income funds with socially responsible investing...