Best-in-class fund flows and
asset allocations data
Every day, EPFR’s leading financial markets data empowers clients from across the globe to make better decisions for their companies and their customers.
With more than 25 years of experience, we are trusted by 100% of the ‘Bulge Bracket’ and 90% of the 20 largest global asset management firms, providing buy-side, sell-side and central banks with a deeper picture of where money is going and why.

How we can help you
Buy-side: Discretionary Market Intelligence
EPFR Fund Flows and Allocations data enables Market Intelligence teams to make more confident stock decisions, better monitor your competition and minimize risks.
Dig deeper to reveal the investible truth using our multiple filtering options, which include key parameters such as asset class (ETFs, mutual funds), country (developed and emerging markets), sector, industry, client firm, or corporate actions.
Our solutions:
- Fund Flows datasets
- Fund Allocations datasets
Buy-side: Discretionary Portfolio Manager
Portfolio Managers trust EPFR as they can access the most granular and timeliest data in the industry, allowing them to create better investing ideas, improve portfolio performance and manage money more efficiently.
With more than a dozen data filters available to choose from (down to Manager/fund and share class level), you can really follow momentum signals and sharpen your position timing strategy on your search for Alpha.
Our solutions:
- Country Allocations dataset
- Industry Allocations dataset
- Sector Allocations dataset
- Specialized datasets, such as FX Allocations
Buy-side: Quantitative and Hybrid
Improve your risk management strategies and reveal the investible truth that leads to Alpha with EPFR data.
Whether you’re a “front office” or “back office” analyst, we provide you with best-in-class data granularity to support your research, help you validate models and create new trading strategies.
Our solutions:
- Fund Flows datasets
- Fund Allocations datasets
- Hedge Fund Flows dataset
- Bond Fund Flows dataset
Central banks & Supranationals
Better understand cross-border money flows, local equity and debt markets, and flow impact on currency.
With a customizable view for individual desks, you can see reports based on daily, weekly and monthly data feeds and utilize a wide range of filters that mesh with relevant business flows and cycles.
Our solutions:
- Fund Flows datasets
- Country Flows dataset
- FX Allocations dataset
Empty
Your content goes here. Edit or remove this text inline or in the module Content settings. You can also style every aspect of this content in the module Design settings and even apply custom CSS to this text in the module Advanced settings.
Sell-side: Research
Finding the right inputs for your proprietary research can be daunting. EPFR’s data enables Analysts to monitor investor sentiment and Portfolio Manager sentiment more closely, providing them with the level of detail they need to generate more comprehensive reports for their clients.
Our multiple filtering options allow you to customize your reports and reveal the investible truth. Filters include: active versus passive, retail versus institutional, and cap size.
Our solutions:
- Fund Flows datasets
- Fund Allocations datasets
- Stock Flows dataset
- Bond Fund Flows dataset
Sell-side: Capital Markets
Gain a deeper understanding of how money is moving and the assets flows driving global markets.
EPFR’s data granularity (down to manager/fund and share class level) supports both Equity and Debt Capital Markets teams, offering a richer investor sentiment view to upskill your client conversations.
Our solutions:
- Fund Flows datasets
- Fund Allocations datasets
- Stock Barometer
- Fixed Income Barometer
Sell-side: Sales and Trading
In an ever-changing world, EPFR’s market-leading Fund Flows and Allocations data provides Sales and Trading teams with the intelligence they need to make more confident decisions, generate better ideas and uncover the best opportunities for your firm to create trading volume.
Our solutions:
- Fund Flows datasets
- Fund Allocations datasets
- Premium Daily Report
“I’m not aware of any other platform that provides the same granularity and coverage!”
Main sponsor, Financial Services Provider
Our solutions
Empty
Your content goes here. Edit or remove this text inline or in the module Content settings. You can also style every aspect of this content in the module Design settings and even apply custom CSS to this text in the module Advanced settings.
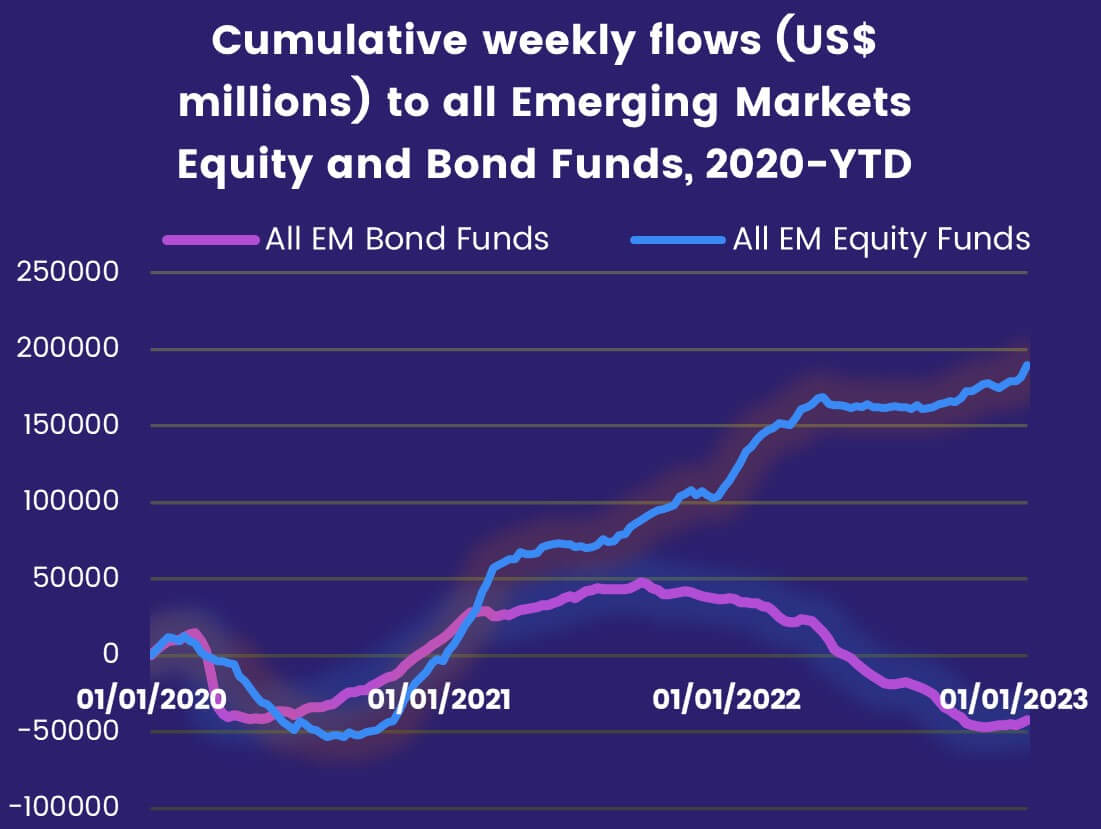
Fund Flows and Allocations data
Unlock insight on where money is moving, how fund managers are investing, and what impact those shifts have at a more granular level.
Dating back to 1995, our Fund Flows datasets provide as-reported coverage of the net flows into and out of a universe of over 150,000 share classes and $50 trillion in assets tracked (AUM).
A subset of these funds report country, sector and industry allocations.
Empty
Your content goes here. Edit or remove this text inline or in the module Content settings. You can also style every aspect of this content in the module Design settings and even apply custom CSS to this text in the module Advanced settings.
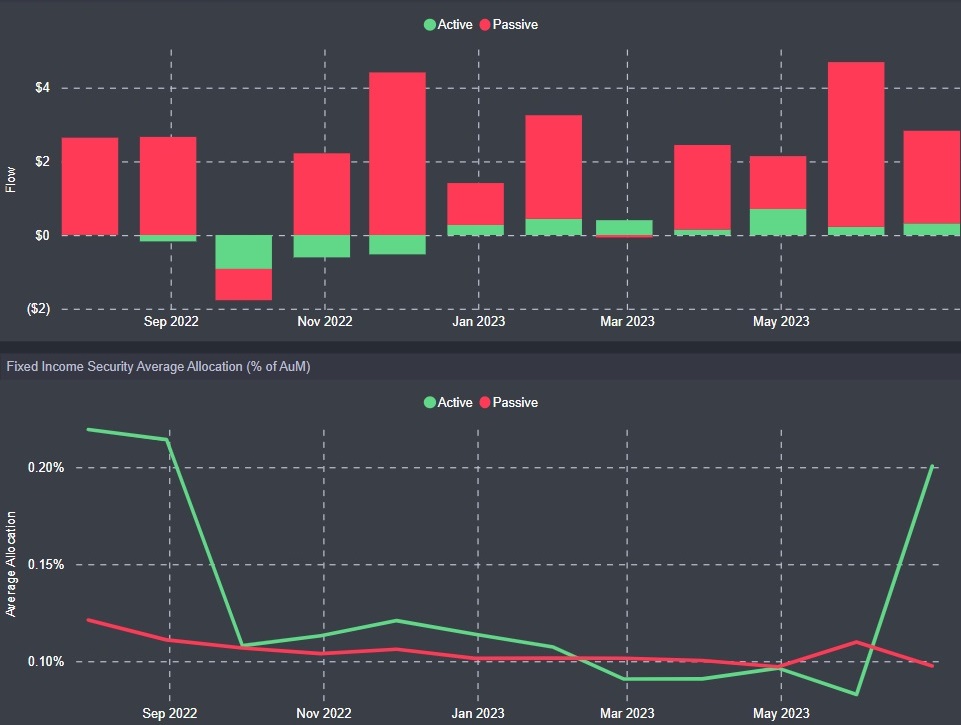
Security-level flows data
Gain a window into the ownership of, and demand for, more than 20,000 stocks and over 50,000 individual bonds and fixed income securities.
Our derived datasets combine monthly flows with the latest security-level allocations data for major fund groups, covering:
- Stock Flows and Allocations
- Stock Barometer
- Fixed Income Flows and Holdings
Empty
Your content goes here. Edit or remove this text inline or in the module Content settings. You can also style every aspect of this content in the module Design settings and even apply custom CSS to this text in the module Advanced settings.
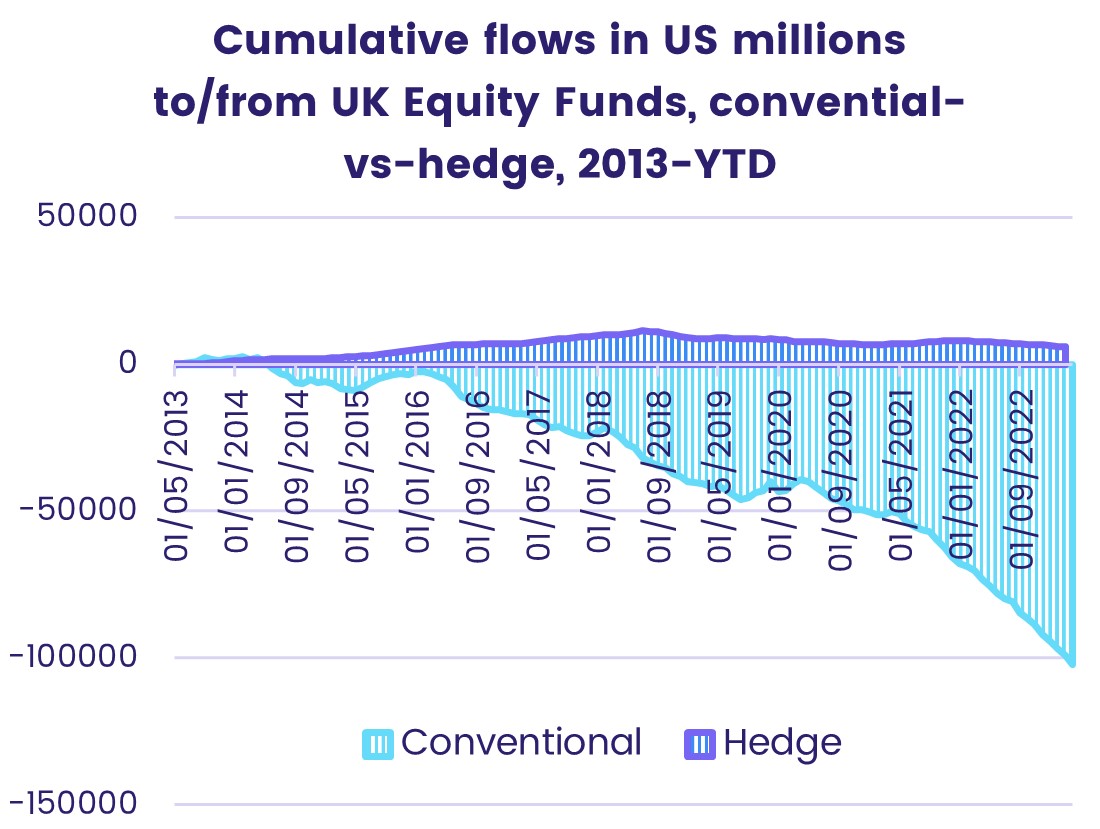
Specialized flows, allocations and markets data
Go deeper and find the insights that will help you reveal the investible truth with our specialized datasets.
- Hedge Fund Flows
- China Share Class Allocations
- FX Allocations
- iMoneyNet (Money Market Fund Data)
- PlacementTracker (PIPE & private placement markets)
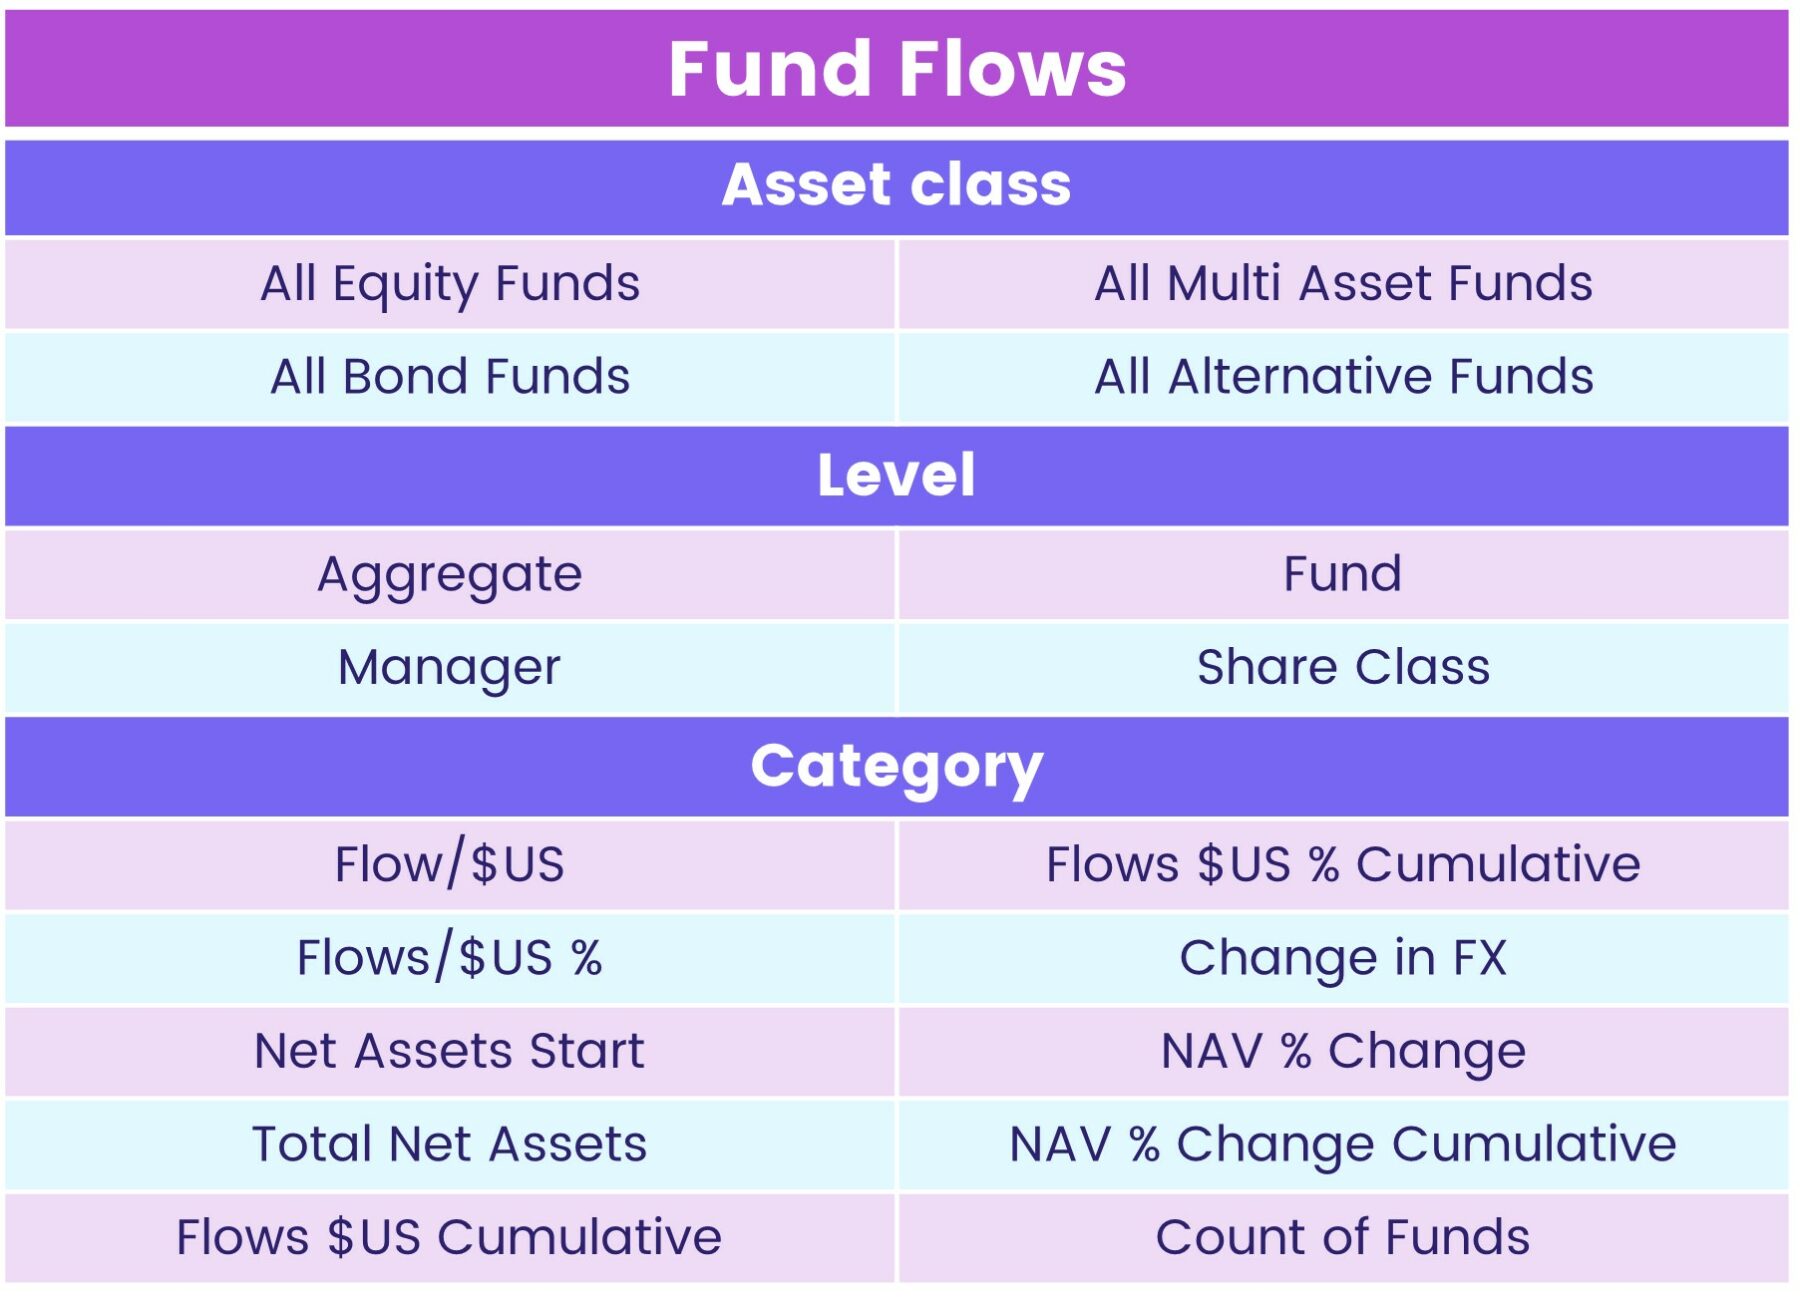
Best-in-class granularity
With over two dozen filters available, EPFR clients really get to see where money is moving and why, allowing them to go back in time for a deeper view of portfolio and investor sentiment.
- Investor type (retail, institutional) and style (active, passive)
- Aggregate, fund manager, fund domicile, and share class level
- Theme (benchmark ESG/SRI, Sharia, etc.)
- Currency of flows
- ETFs and mutual funds
- Developed versus emerging markets
- Frequency (daily, weekly, monthly)
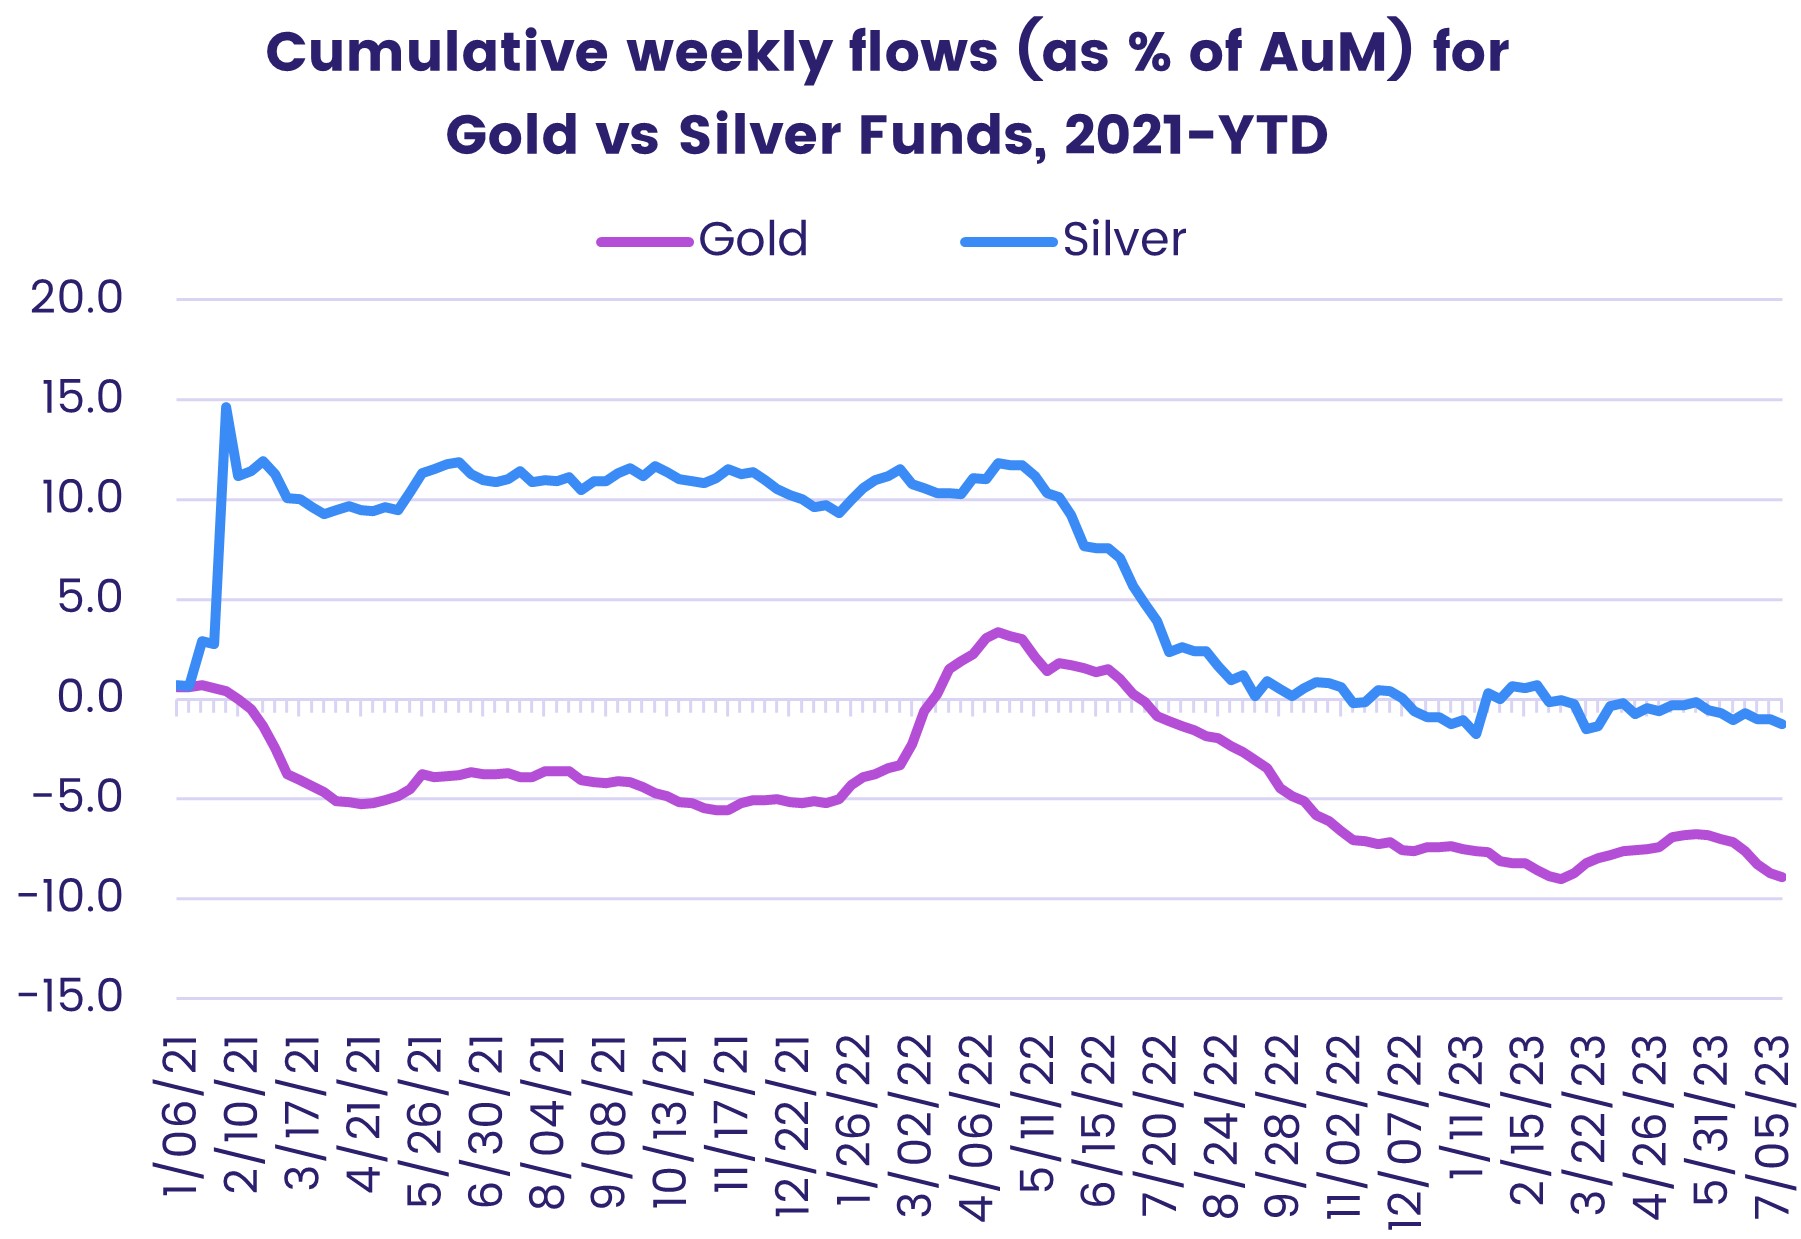
Clearer pathway to Alpha
Provide empirical data around which countries, sectors, industries, and stocks are seeing investments, and which are seeing redemptions. Join the dots between key geo-political events and their market impact from a flow perspective.
Clients use EPFR’s Fund Flows and Allocation data to generate Alpha in both discretionary and quantitative investment processes, as an input in top-down asset allocation decisions, as well as bottom-up stock screening strategies.
High-quality data you can trust
EPFR obtains data directly from fund managers and administrators, who provide it as part of their accounting process. In many cases, our partnerships are built on strong, long-lasting relationships spanning over two decades.
To ensure the highest data accuracy possible, the EPFR team undergoes several layers of internal quality control before we release it to our clients.
We offer daily, weekly and monthly data updates, in addition to historical time series, enabling clients to select the right data frequency for their business case.
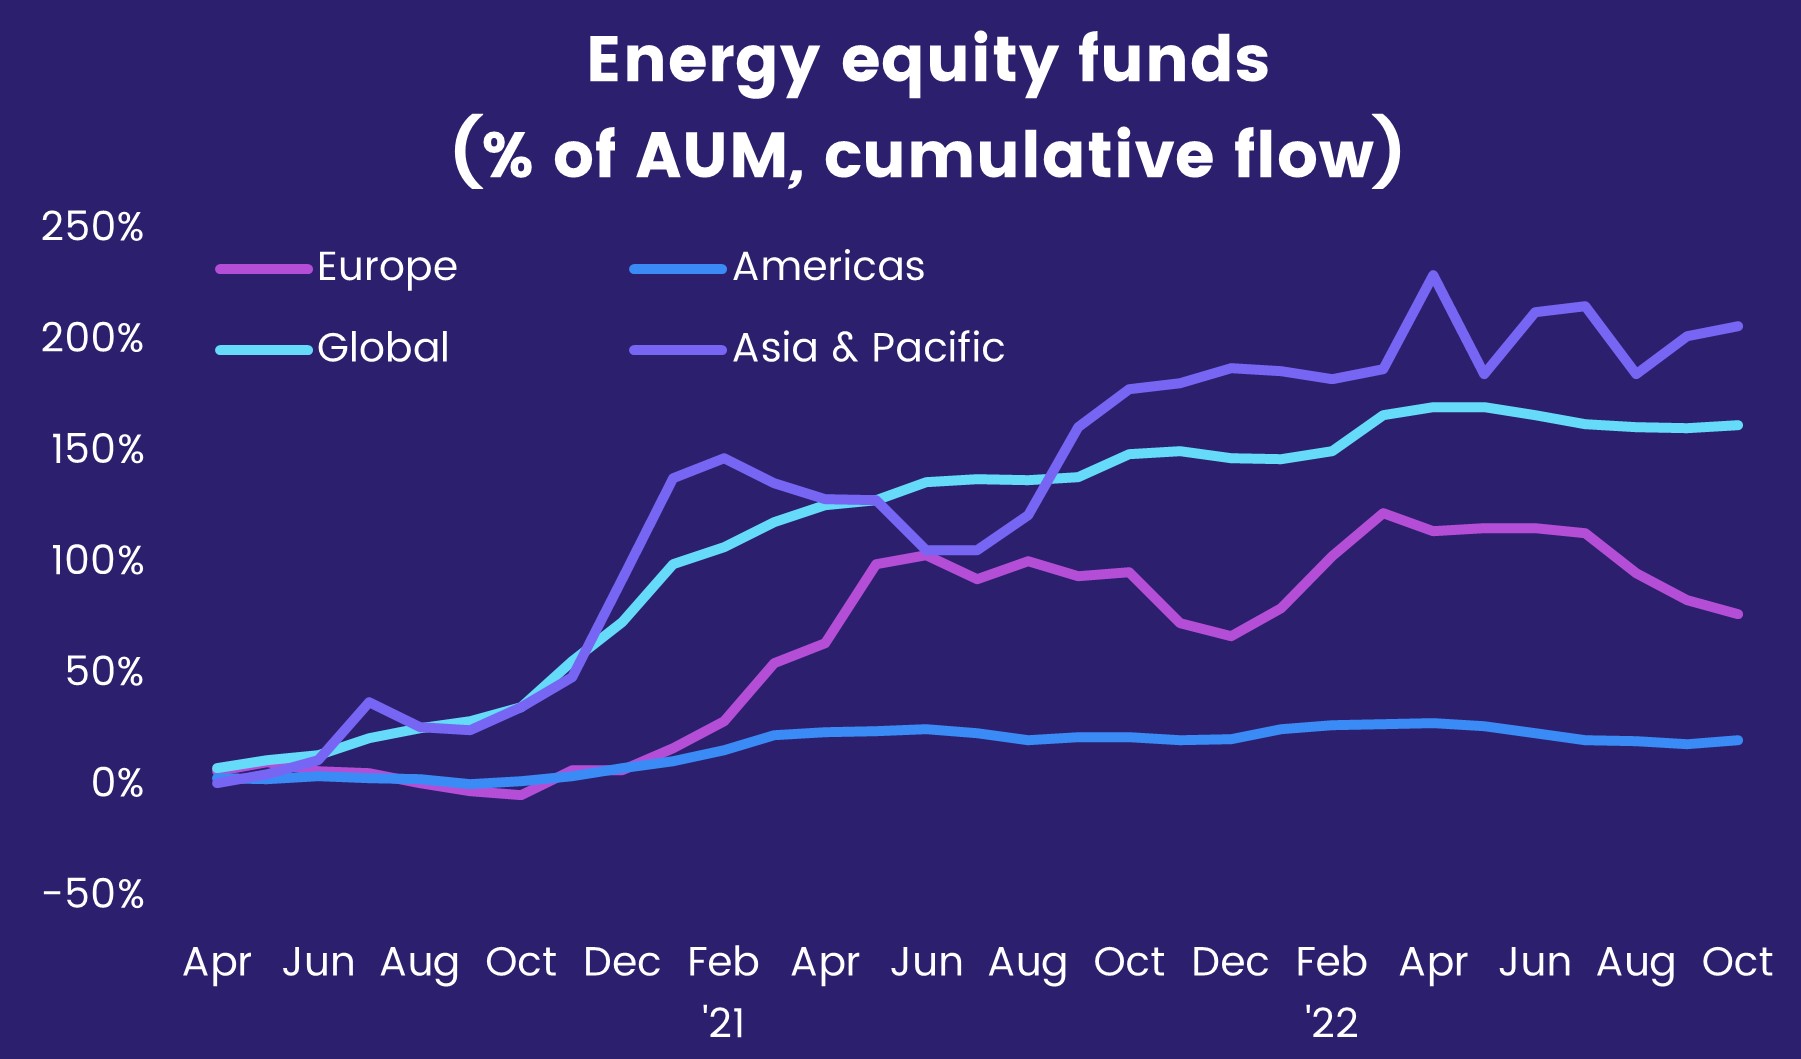
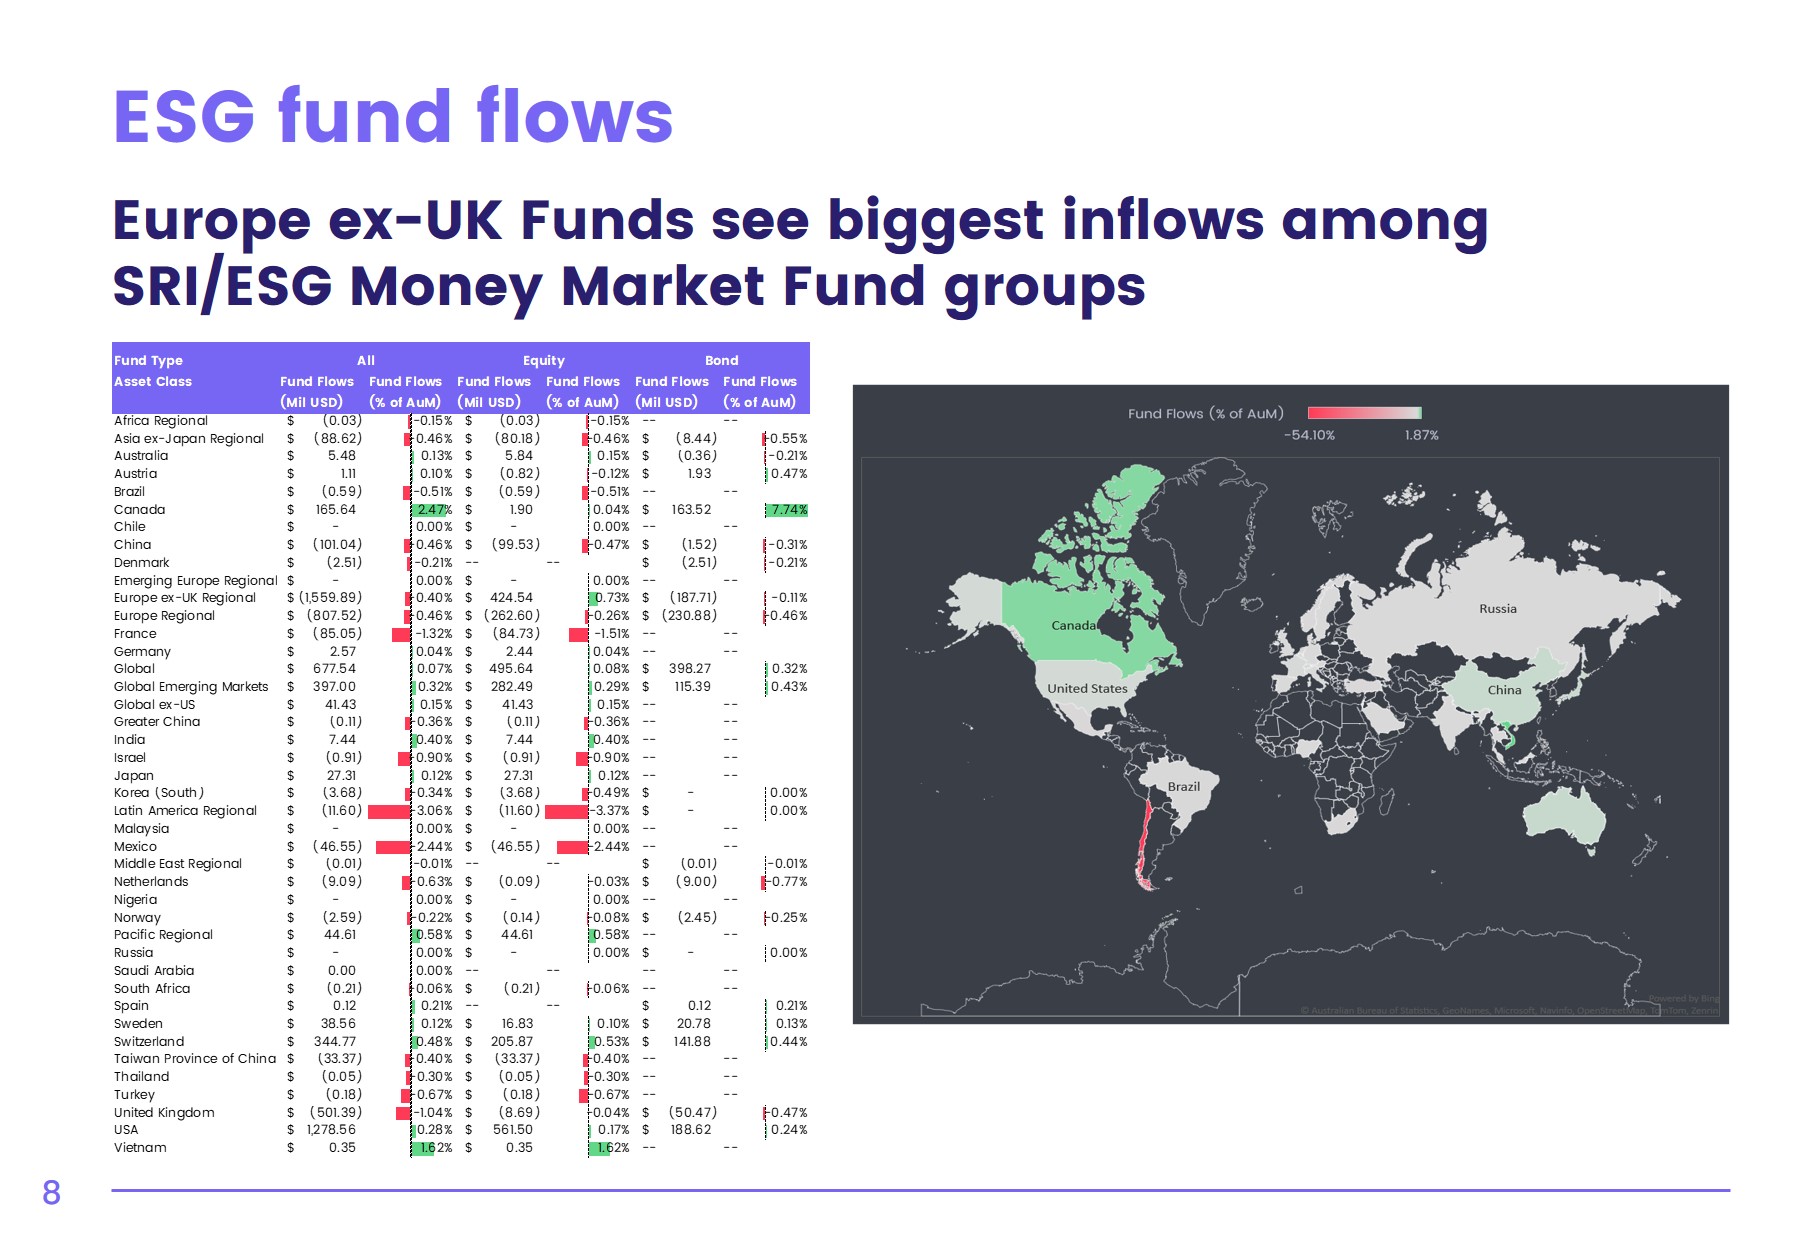
Manage risks more wisely
Our numerical and qualitative snapshots of major fund groups enable EPFR clients to mitigate downside volatility and avoid portfolio drawdowns.
Every week, our EPFR Chartbook offers key insights into flows and a detailed analysis of the factors driving current flow trends.
Want to learn more about our Chartbook?
Our Latest Insights
1Q24 Recap Webinar
Investors feel the squeeze in early April

